U.S. Municipal Waste Generation, Recycling, and Environmental Impact: 2018 Analysis Highlights Shifts in Sustainability Efforts
The U.S. EPA’s 2018 report highlights major progress in waste management and recycling. The nation generated 292.4 million tons of municipal solid waste, recycling over 69 million tons — with paper and paperboard making up nearly 67% of total recycling. Recycling rates for paper reached 68.2%, cutting 155 million metric tons of CO₂ emissions, equal to removing 33 million cars from the road. While plastics and food waste still dominate landfills, overall recycling and energy recovery have grown, and landfilling has dropped to 50%, marking steady progress toward sustainability.
Ottawa, Nov. 03, 2025 (GLOBE NEWSWIRE) -- The U.S. Environmental Protection Agency’s (EPA) 2018 data on materials, waste, and recycling reveals significant progress and shifting trends in how the nation generates and manages municipal solid waste (MSW). The report showcases growing recycling efforts, improved resource recovery, and notable environmental benefits, particularly from paper and paperboard recycling, according to research conducted by Towards Packaging, a sister firm of Precedence Research.
Request Research Report Built Around Your Goals: sales@towardspackaging.com
U.S. Waste Generation Overview
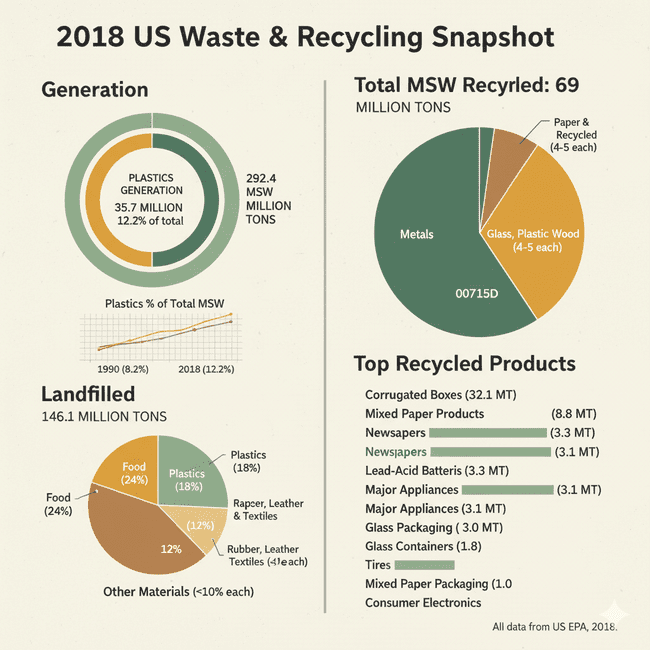
In 2018, the United States generated approximately 35.7 million tons of plastic products, accounting for 12.2% of total municipal solid waste. This marked an increase of 4.3 million tons compared to 2010, primarily driven by growth in durable goods and packaging materials. Over the decades, plastics have steadily grown from 8.2% of total waste in 1990 to 12.2% in 2018, consistently ranging between 12.2% and 13.2% in recent years.
That same year, the country successfully recycled over 69 million tons of MSW, with paper and paperboard making up nearly 67% of the recycled material. Metals contributed about 13%, while glass, plastics, and wood each represented roughly 4–5% of total recycling.
Among the most recycled items by weight in 2018 were:
- Corrugated boxes (32.1 million tons)
- Mixed nondurable paper products (8.8 million tons)
- Newspapers and mechanical papers (3.3 million tons)
- Lead-acid batteries (2.9 million tons)
- Major appliances and wood packaging (each 3.1 million tons)
- Glass containers (3 million tons)
- Tires (2.6 million tons)
- Mixed paper containers and packaging (1.8 million tons)
- Selected consumer electronics (1 million tons)
Together, these materials represented 90% of total U.S. recycling in 2018.
Despite progress in recycling, 146.1 million tons of waste were landfilled. The largest share came from food waste (24%), followed by plastics (over 18%), paper and paperboard (12%), and rubber, leather, and textiles (11%). Other materials contributed less than 10% each.
Invest in Our Premium Strategic Solution: https://www.towardspackaging.com/contact-us
Evolving Waste Generation and Management Trends
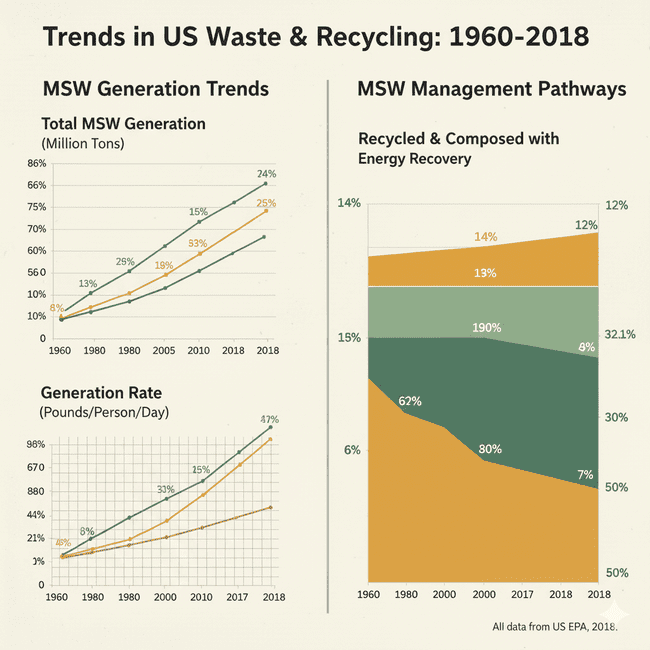
Over the past several decades, the landscape of waste generation and management in the U.S. has changed dramatically. Total MSW generation rose from 88.1 million tons in 1960 to 292.4 million tons in 2018, reflecting population growth and changing consumption patterns.
Although there was a slight 1% decline between 2005 and 2010, waste generation rebounded by 7% from 2010 to 2017, largely due to the inclusion of new food management pathways added by the EPA.
On a per capita basis, the generation rate increased from 2.68 pounds per person per day in 1960 to 4.9 pounds per person per day in 2018 an 8% rise from 2017.
Recycling and composting have seen consistent growth, expanding from 6% of total MSW in 1960 to 35% in 2017, before slightly dipping to 32.1% in 2018. Meanwhile, energy recovery from waste has become more common, growing from virtually zero in 1960 to 12% in 2018. Landfilling has steadily declined, falling from 94% of total waste in 1960 to just 50% in 2018, underscoring the nation’s progress toward waste diversion and sustainability.
Material Generation and Recycling Trends
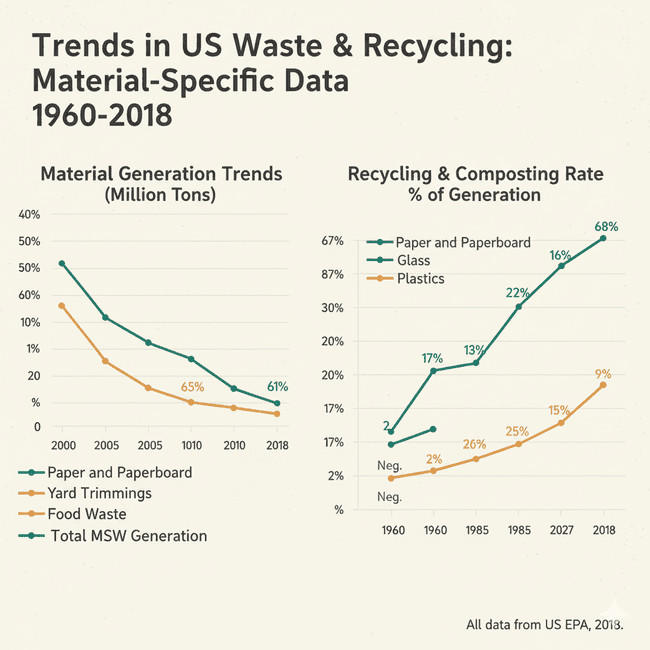
Paper and paperboard remain the largest components of MSW, though their generation has decreased from 87.7 million tons in 2000 to 67.4 million tons in 2018. Conversely, yard trimmings and food waste have increased steadily since 2000. Overall, waste generation grew consistently between 1960 and 2005, dipped from 2005 to 2010, and then rose again through 2018.
The recycling landscape has improved significantly over the decades:
- Paper and Paperboard: From 17% in 1960 to 68% in 2018.
- Glass: From 2% in 1960 to 25% in 2018.
-
Plastics: From negligible levels in the 1960s to 9% in 2018.
These improvements reflect advances in recycling systems, broader consumer participation, and growing environmental awareness.
Paper and Material Recycling Performance and Environmental Impact in 2018
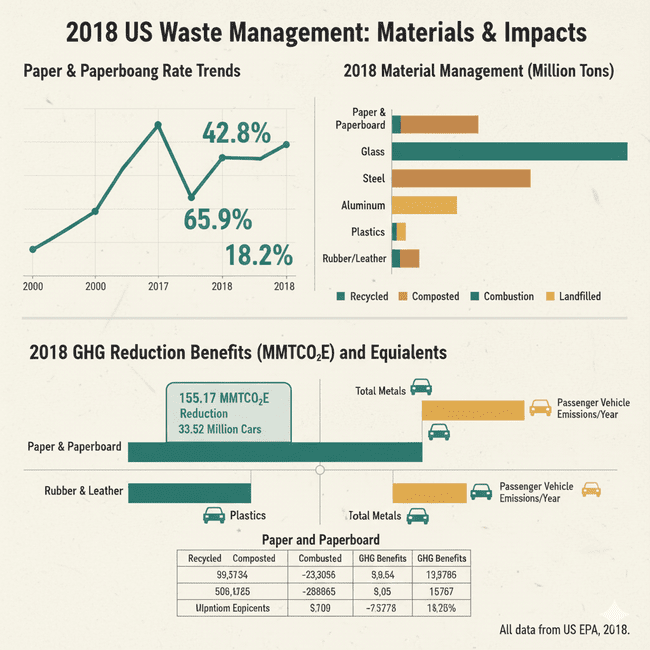
In 2018, the recycling rate for paper and paperboard reached 68.2% (46 million tons), marking an increase from 65.9% (44.2 million tons) in 2017 and a significant rise from 42.8% in 2000. This high recovery rate made paper and paperboard the largest contributors to waste reduction in the U.S.
Recycling these materials led to a reduction of over 155 million metric tons of carbon dioxide equivalent (MMTCO₂E) the greatest impact among all material categories. To put this into perspective, this reduction is equivalent to removing more than 33 million cars from the road for one year, demonstrating the strong environmental benefits of paper recycling.
The 2018 data underscores the importance of sustained efforts in waste management and recycling. As recycling infrastructure improves and public participation grows, the U.S. continues to make progress toward reducing landfill dependence, conserving resources, and cutting greenhouse gas emissions.
The success of paper and metal recycling illustrates how targeted material recovery efforts can yield substantial climate and sustainability benefits. Continued investment in recycling technology, public awareness, and circular economy strategies will be key to building a cleaner, more resource-efficient future.
Request Research Report Built Around Your Goals: sales@towardspackaging.com
About Us
Towards Packaging is a global consulting and market intelligence firm specializing in strategic research across key packaging segments including sustainable, flexible, smart, biodegradable, and recycled packaging. We empower businesses with actionable insights, trend analysis, and data-driven strategies. Our experienced consultants use advanced research methodologies to help companies of all sizes navigate market shifts, identify growth opportunities, and stay competitive in the global packaging industry.
Towards Packaging Releases Its Latest Insight - Check It Out:
- Packaging Waste Recycling Market Research, Consumer Behavior, Demand and Forecast
- Packaging Waste Management Market Size, Segments and Regional Data (NA/EU/APAC/LA/MEA) 2025-2034
- Zero Waste Packaging Market Driven by 9.65% CAGR
- Hazardous Waste Bag Market Growth Drivers, Challenges and Opportunities
- Sustainable Packaging Market Size, Segments, Regional Data (NA/EU/APAC/LA/MEA)
- Sustainable Foodservice Packaging Market Size, Segmentation, and Regional Insights
- Sustainable Secondary Packaging Market Trends, Investment Opportunities
- Sustainable Pharmaceutical Packaging Market Growth, Innovations
- Sustainable E-commerce Packaging Market Booms with Plastic
- Single Serve Packaging Market Outlook 2025-2034

![]()
Legal Disclaimer:
EIN Presswire provides this news content "as is" without warranty of any kind. We do not accept any responsibility or liability for the accuracy, content, images, videos, licenses, completeness, legality, or reliability of the information contained in this article. If you have any complaints or copyright issues related to this article, kindly contact the author above.
